
Data Design – Visualization of Data
Data Design – or the visual display of quantitative information (E. Tufte) is a design dicipline with long tradition as well as great potential in the context of “Big Data”. Timo Daum has been teaching Data design in his information management course and as part of a lecture on applied media.
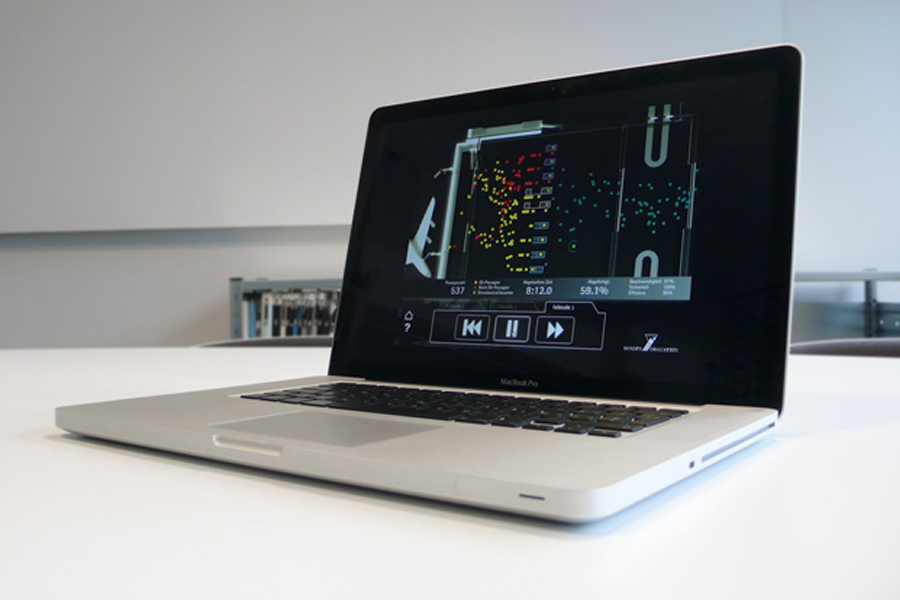
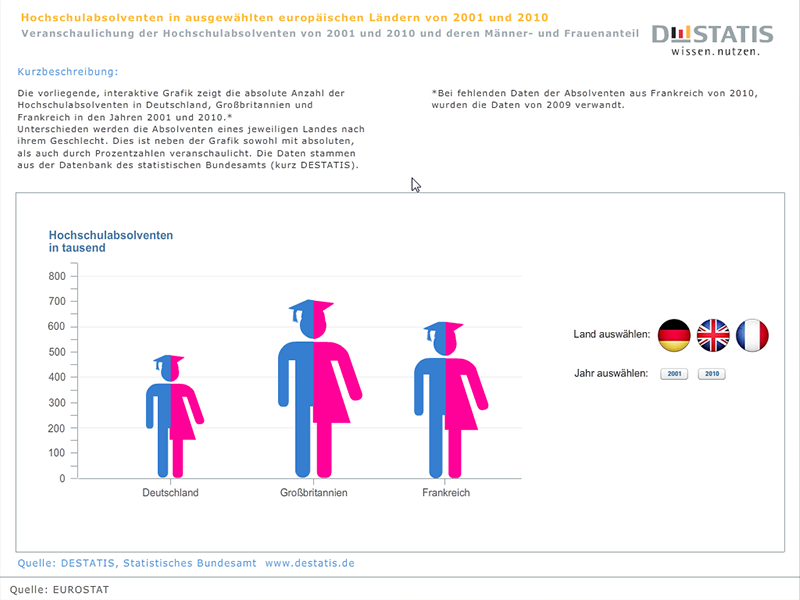
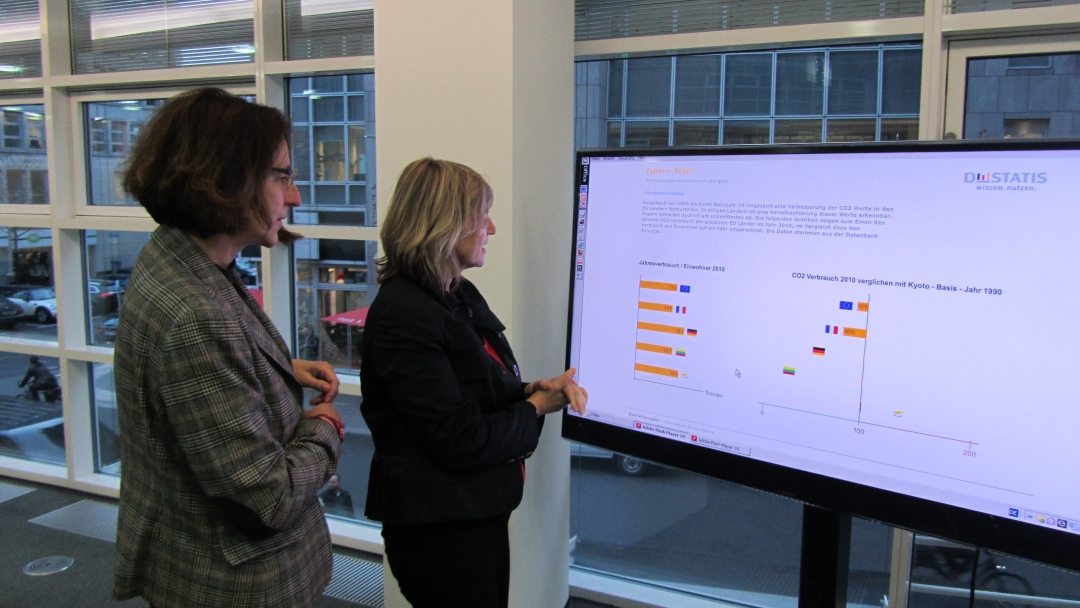
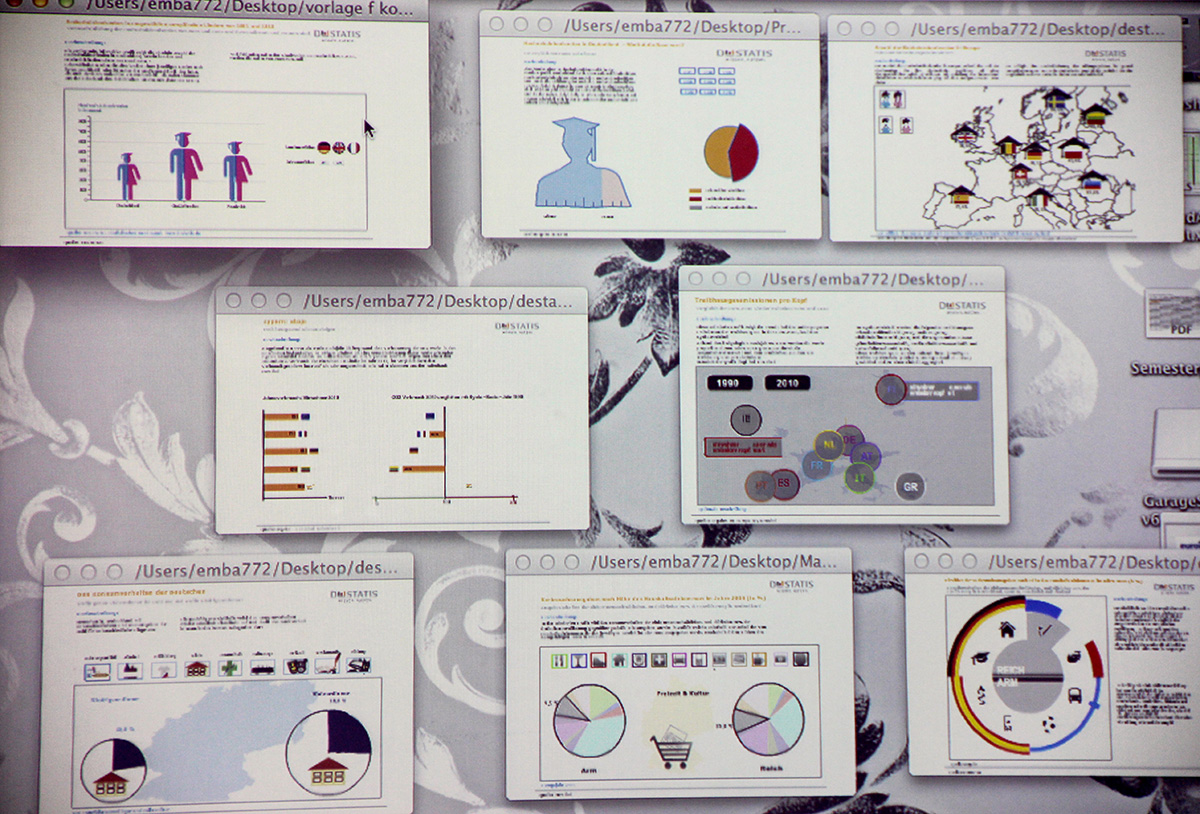
In a collaboration with DESTATIS – Statistisches Bundesamt EMBA students developped animated and interactive sketches displaying statistical data (Applied media course, 2013)
Contents
- Historic examples
- Design rules for the display of statistical data
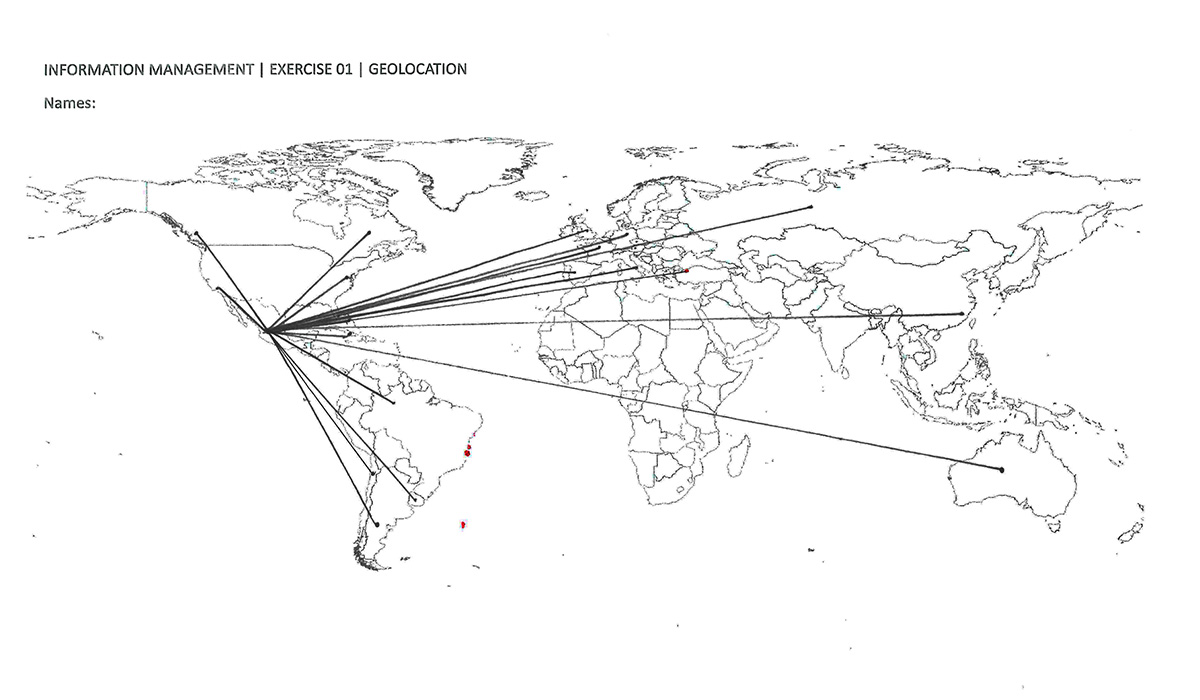
- Graphs, charts and maps
- Big data and visualization concepts
- Examples
- Technologies
- Interaction
- Animation, time based media